The Scheme Illusion: Why a +35% Sales Lift Might Actually Be Losing You Money
 Parth Yadav · September 2026
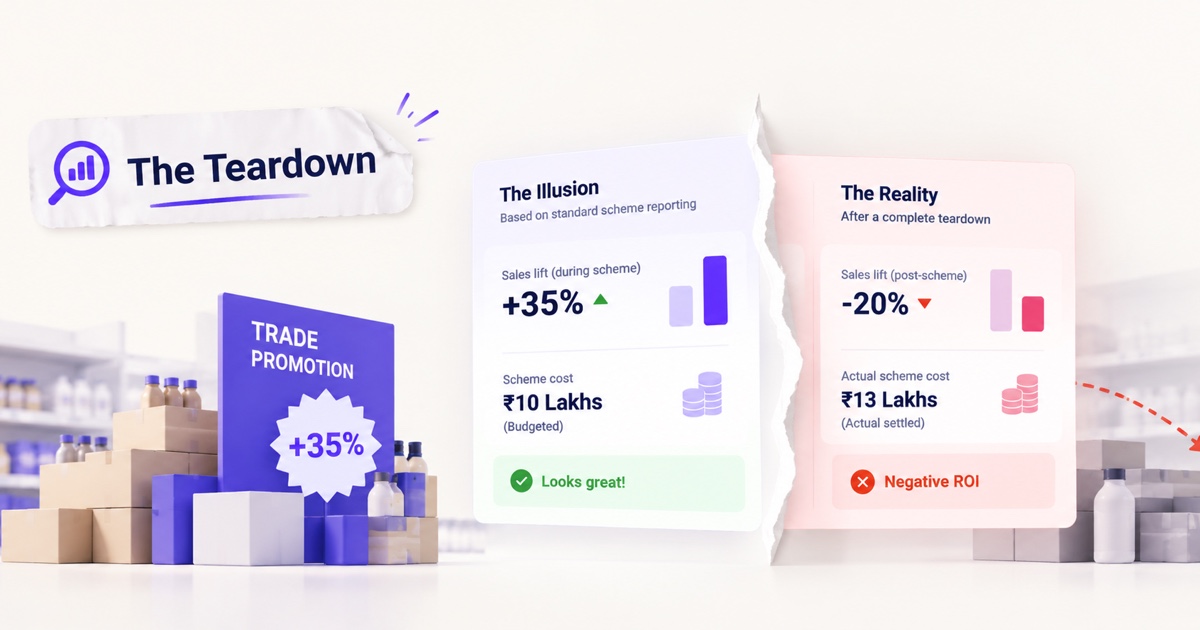
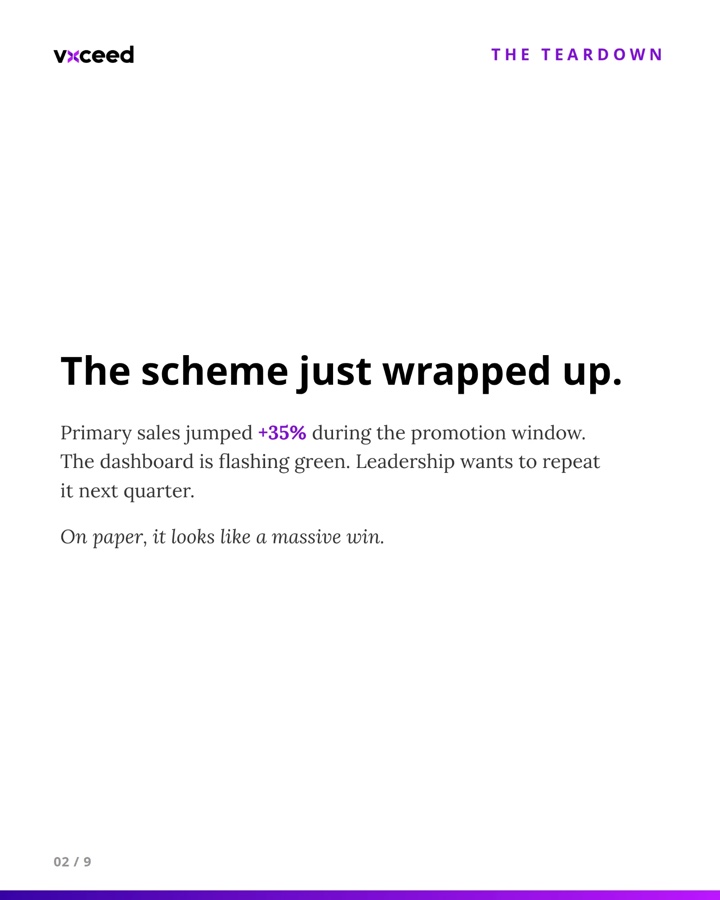
Picture a trade promotion scheme that just wrapped up. The dashboard looks fantastic: primary sales jumped 35% during the promotion window. The sales team is celebrating, leadership is already talking about repeating it next quarter, and on paper, this scheme was a massive win.
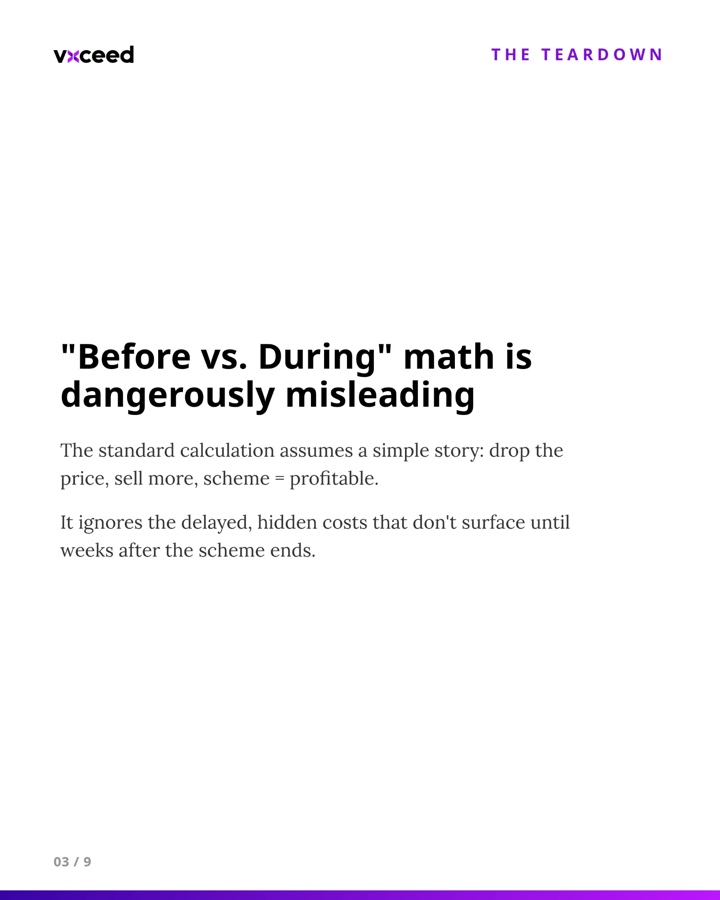
But when we looked under the hood of a real, recently completed scheme just like this one, the math told a different story. Here is why the standard industry calculation of "sales during the scheme vs. before" can be dangerously misleading, and how it can mask a negative return without anyone noticing until weeks later.


The Teardown, in nine slides. Tap through, or let it play.
The Problem with "Before vs. During" Math
The traditional way to measure trade promotion ROI assumes a simple, linear relationship: drop the price, sell more product, so the scheme was profitable.
That calculation leaves out the delayed costs that do not surface until weeks after the scheme ends. When we ran the numbers on this specific +35% growth scheme, two blind spots stood out.
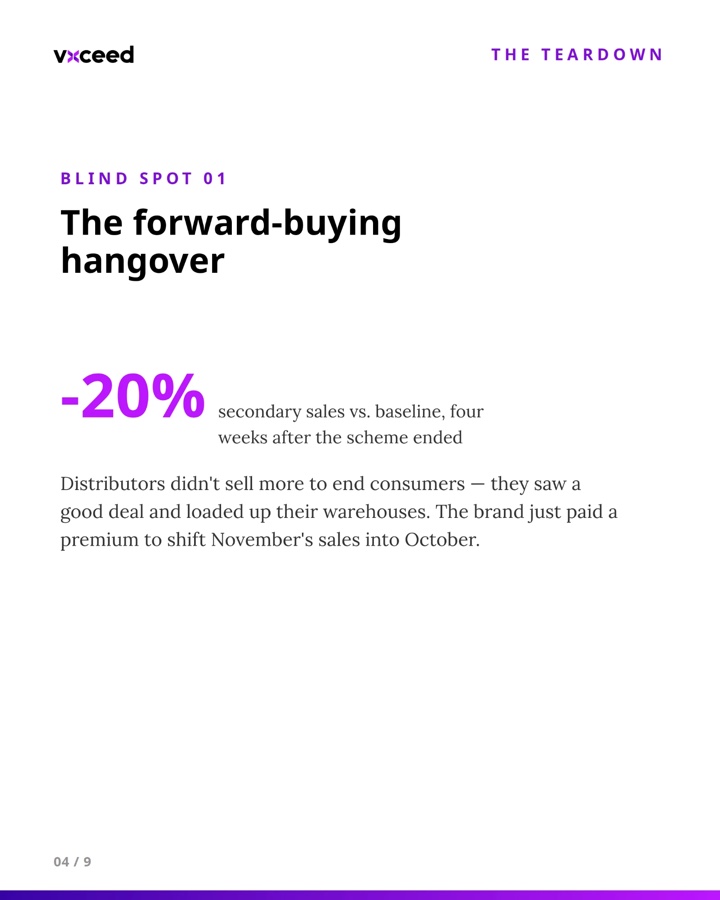
Blind Spot One: The Forward-Buying Hangover
In this teardown, we did not stop at the promotion window. We looked at secondary sales four weeks after the scheme ended.
Distributors had not sold more product to end consumers. They had recognized a good deal and loaded up their warehouses at a discount. The brand had not generated new, incremental demand. It had paid a premium to shift regular November sales into October.
Blind Spot Two: The Claims Blowout
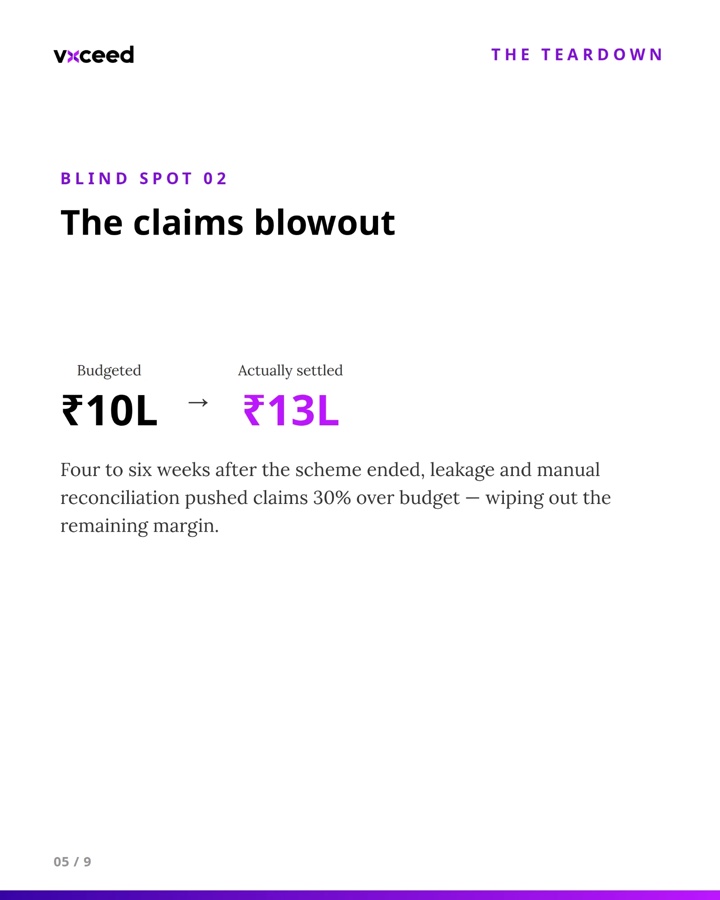
The second blind spot is the delay in claims settlement. When this scheme launched, the trade spend budget was capped at ₹10 lakhs. If claims matched the budget, the ROI was, on paper, positive.
Traditional CRMs and spreadsheets do not account well for leakage, delayed submissions, and manual reconciliation errors. Four to six weeks after the scheme ended, settled claims came in at ₹13 lakhs: a 30% budget overrun that erased the remaining margin.
Illusion vs. Reality
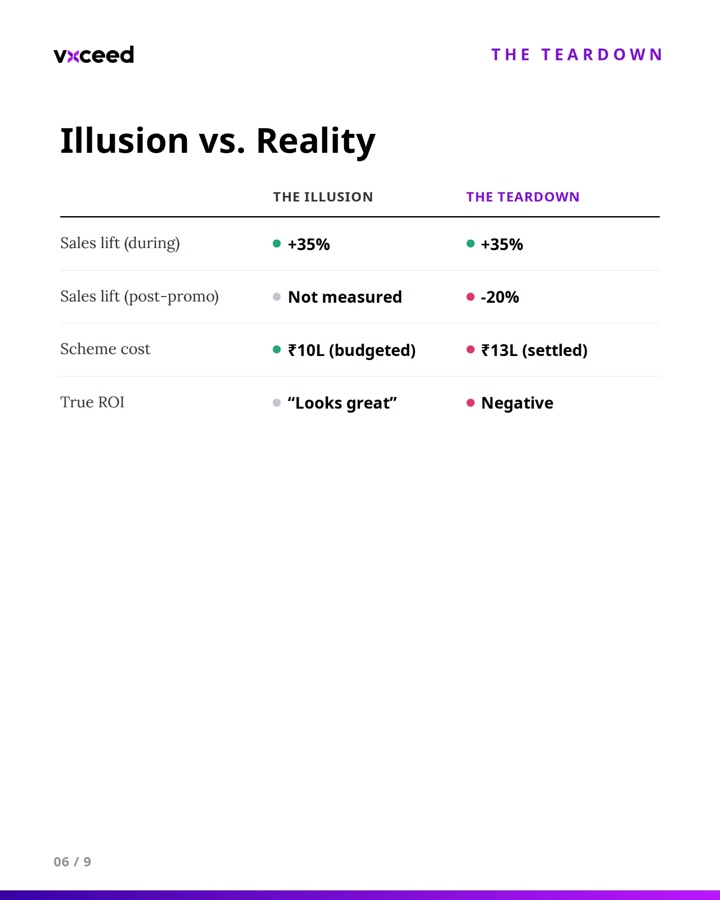
Placed side by side, the traditional view and the fuller picture tell two different stories about the same scheme.
| Metric | The Traditional View | The Fuller Picture |
|---|---|---|
| Sales lift (during) | +35% | +35% |
| Sales lift (post-promo) | Not measured | -20% |
| Scheme cost | ₹10L (budgeted) | ₹13L (settled) |
| True ROI | "Looks great" | Negative |
Once the post-scheme dip and the budget overrun are both counted, the question worth asking is whether this scheme created any value at all, or quietly worked against the brand's own margin.
Why This Happens, and How to Close the Gap
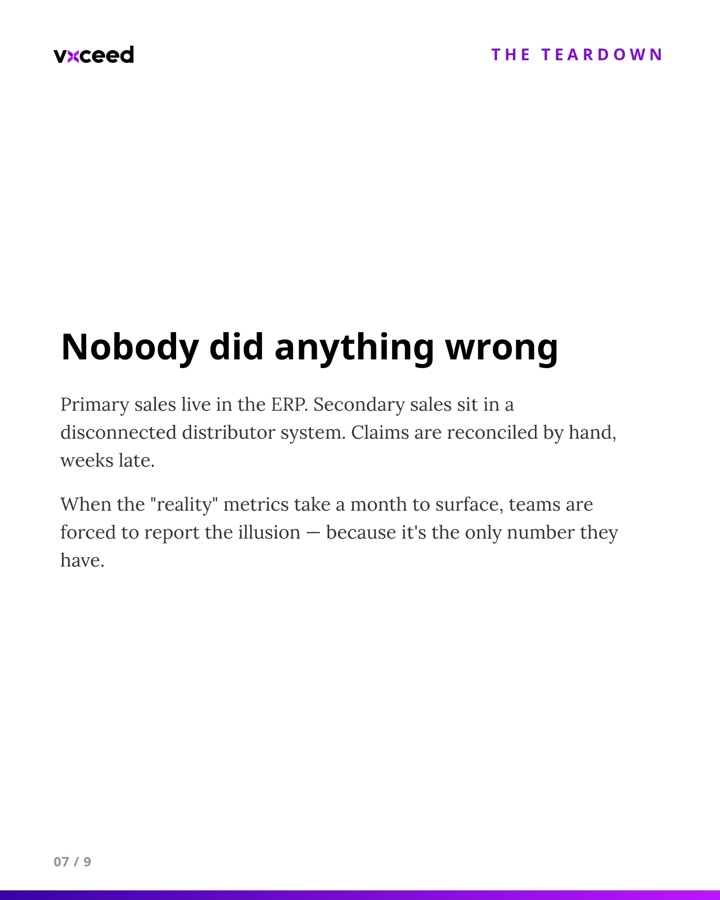
The brand manager who ran this scheme did not do anything wrong. They were not bad at their job. They were making the best call they could with the numbers in front of them.
When primary sales live in an ERP, secondary sales sit in a disconnected distributor system, and claims are reconciled by hand on a spreadsheet weeks later, calculating true ROI while the scheme is still running is not realistically possible. Teams end up reporting the "illusion" metrics because the "reality" metrics take too long to gather.
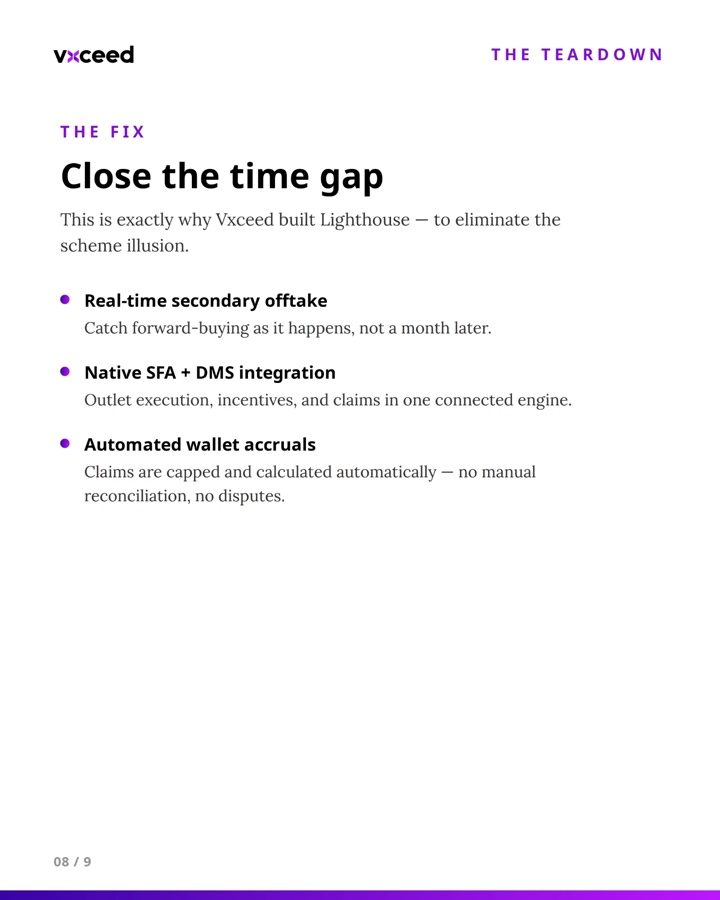
Closing that time gap means tracking distributor offtake in real time to catch forward buying as it happens, and automatically calculating and capping claims so a ₹10L budget does not quietly become ₹13L a month later.
Frequently asked questions
The standard "sales during the scheme vs. before" calculation only counts the primary sales spike. It misses two delayed costs: distributors forward-buying at the discount instead of selling more to end consumers, and claims settling weeks later, often well above the original budget. Both show up only after the scheme has already been reported as a win.
It is the drop in secondary sales that follows a scheme once distributors stop buying at the promotional price. Distributors load up their warehouses to capture the discount rather than sell more to retailers and consumers, so the brand pays a premium to shift sales it would have made anyway into an earlier month.
When claims are reconciled by hand across a spreadsheet and a disconnected distributor system, leakage and processing delays accumulate over the four to six weeks it takes to settle. By the time the final number is in, it can run well past the budgeted trade spend and erase the margin the scheme appeared to generate.
By tracking secondary offtake in real time instead of only primary sales, and by automating claim calculation and capping instead of reconciling it by hand weeks later. Closing that time gap is what turns "sales during the scheme" into an honest read on whether the scheme created value.
No. When primary sales live in an ERP, secondary sales sit in a separate distributor system, and claims are reconciled by hand weeks later, calculating true ROI while the scheme is still running is not realistically possible. The gap is in the visibility available, not in how the scheme was run.
Know which schemes make money while they're still running
Vxceed's Lighthouse platform connects outlet execution, primary sales incentives, and claims management into one engine, so secondary offtake and claim accuracy are visible while a scheme is live, not weeks after it ends.
Request a demo

