How to Build a Route-to-Market Strategy: Outlet Segmentation, Channel Mix, and Cost-to-Serve
 Team Vxceed · September 2026
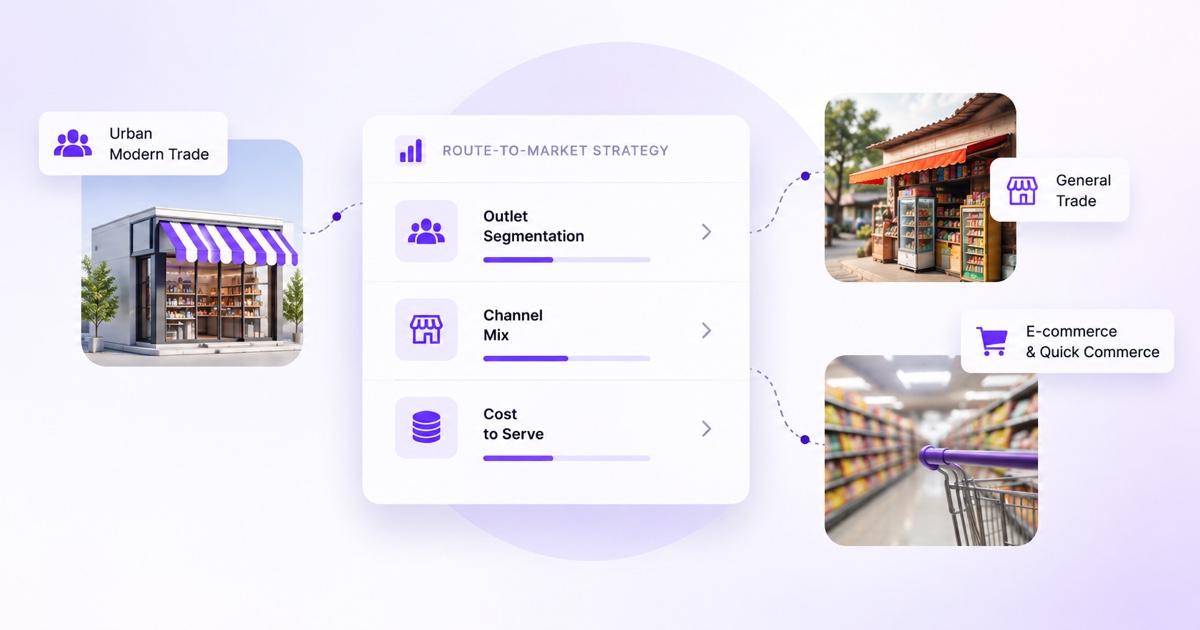
Most route-to-market conversations start in the wrong place. A regional sales head asks for more feet on the street, a distributor asks for more margin, and a CFO asks why cost-to-serve keeps climbing even as revenue grows. Each question is reasonable on its own. Together, they describe a company treating route-to-market as a coverage problem when it is actually a sequencing problem: which outlets earn priority, through which channel, at what visit frequency, and at what cost.
A route-to-market (RTM) strategy is the operating model that answers those questions before the field team has to guess. Done well, it decides how a brand reaches every outlet in its universe, not just the biggest ones, in a way that a distributor, a sales manager, and a finance team can all execute against without contradicting each other.
Why treating every outlet the same is the default failure
Every FMCG distribution network eventually accumulates outlets that behave nothing alike under one coverage plan. A high-velocity urban kirana selling twenty SKUs a week and a low-footfall rural outlet selling three end up on the same beat, visited at the same frequency, stocked against the same norms. The urban outlet goes out of stock between visits. The rural outlet carries dead inventory it never sells through before the next call.
Neither failure shows up as a single dramatic number. It shows up as a slow accumulation: stockouts on fast movers, working capital parked in slow ones, and a field team that has stopped trusting the beat plan because it does not match what they see on the ground. Most RTM rebuilds start here, not because leadership decided distribution needed a strategic overhaul, but because the field data finally made the mismatch impossible to ignore.
The fix starts with a decision most brands skip: not every outlet deserves the same coverage model, and pretending otherwise is the single most common reason RTM plans underperform their own targets.
The four decisions that make up an RTM strategy
An RTM strategy is really four sequential decisions. Skipping one does not simplify the plan, it just pushes the problem downstream to whichever team executes next.
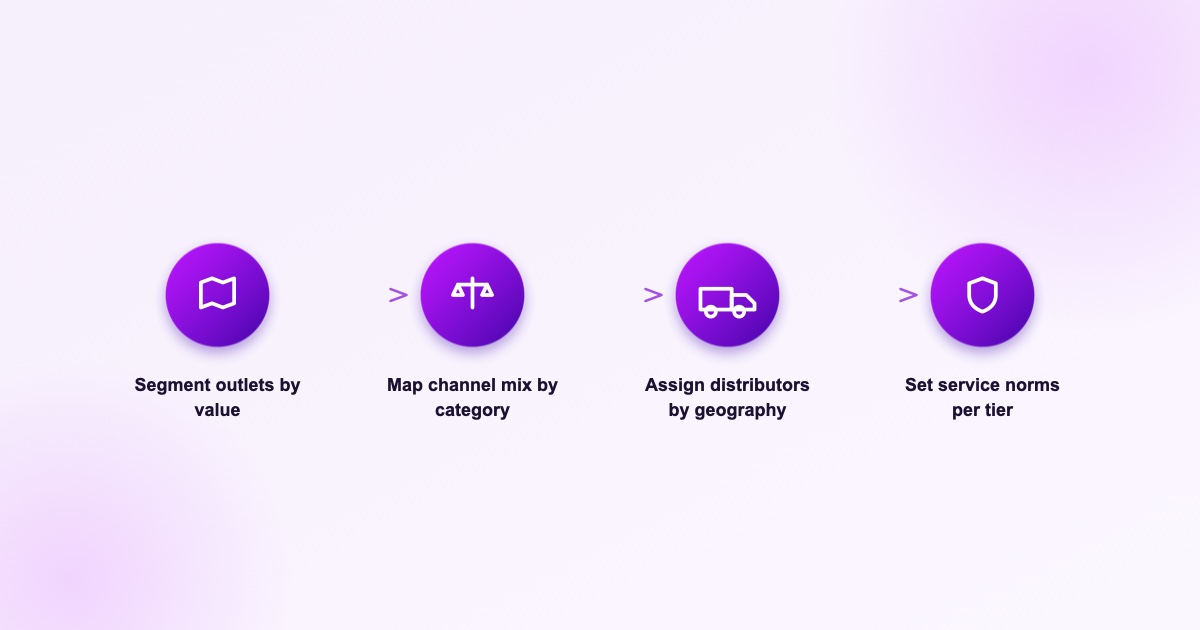
Segment outlets by value, not just by size. Revenue is the easy variable to sort by, and the wrong one to sort by alone. A useful segmentation weighs sales velocity, basket size, growth trend, and credit risk together, because a high-revenue outlet with slow-paying credit and flat growth is a worse bet than a mid-revenue outlet accelerating month over month.
Map channel mix by category, not by company-wide default. A single national channel policy is easier to write and consistently wrong for at least one category. What moves through general trade in personal care rarely matches what moves through general trade in packaged food, and treating modern trade and traditional trade as interchangeable distribution problems produces a plan neither channel executes well.
Assign distributors and direct coverage by geography, not by relationship history. Legacy distributor territories often reflect who was available when the market opened, not who is best positioned for where demand has moved since. Reassigning territory is politically harder than redrawing a map, which is exactly why most networks carry geographic mismatches for years past their expiry date.
Set service norms per tier, and hold them. A segmentation model is only as good as the visit frequency and order cycle it produces. Top-tier outlets need a service level that protects on-shelf availability; lower tiers need a cycle that does not bury a rep in low-yield calls. The norms have to survive contact with a real beat plan, not just look clean in a planning deck.
What a mismatched RTM strategy actually costs
The cost of getting RTM wrong rarely appears as one line item. It shows up distributed across sales, operating cost, and working capital, which is exactly why it survives quarterly reviews for so long: no single metric owns the whole problem.
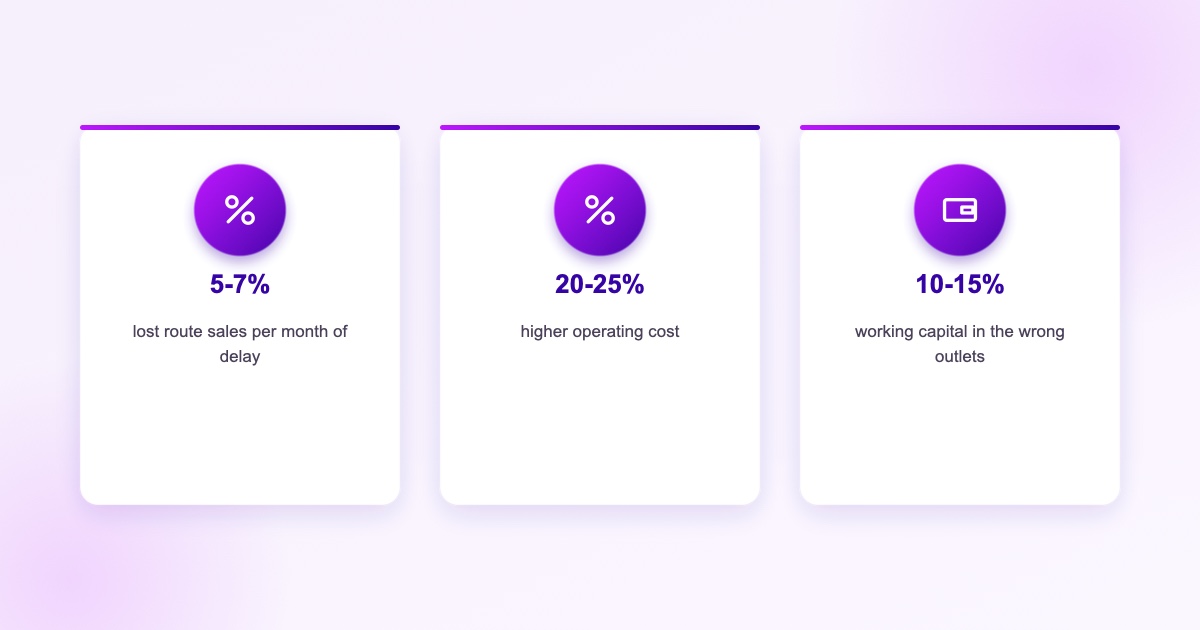
For a mid-sized network, each month a mismatched RTM model stays in place can mean roughly 5–7% of route sales lost to stockouts on fast movers, 20–25% higher operating cost from inefficient beats and emergency reloads, and 10–15% of working capital sitting in slow-moving stock at the wrong outlets. None of these numbers alone triggers an intervention. Together, over a full fiscal year, they represent value destruction that usually exceeds the cost of fixing the underlying segmentation.
The pattern is consistent enough to plan around: the outlets losing the company money are rarely the smallest ones. They are the mid-tier outlets that got sorted into a generic coverage bucket instead of a segment that matched how they actually sell.
Choosing channel mix: general trade, modern trade, and direct
Channel mix is where most RTM strategies either earn their keep or quietly fail. The three broad models, indirect distribution through distributors and wholesalers, direct-to-retail, and modern trade through centralized buying desks, are not competing options to pick one of. They are tools that fit different parts of the same outlet universe.
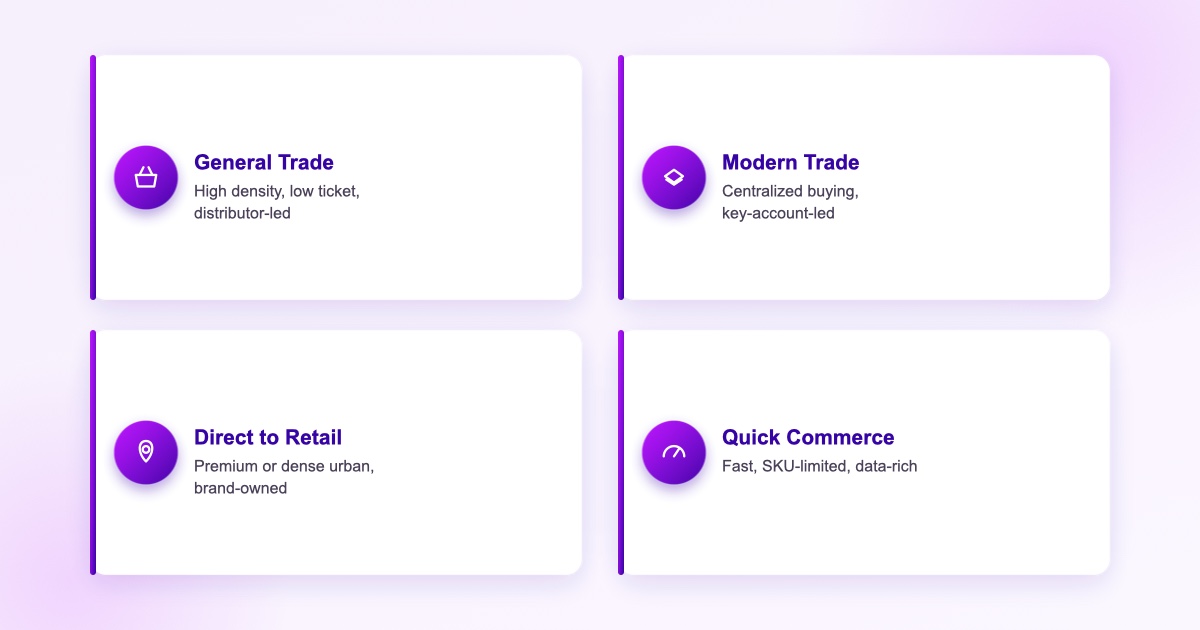
General trade, still the majority of FMCG volume across most emerging markets, is distributor-led by necessity. Outlet density is too high and ticket size too low for direct coverage to pay for itself outside dense urban clusters. Modern trade runs on a different logic entirely: centralized buying, key account management, and terms of trade negotiated once and applied across hundreds of stores. Direct-to-retail sits between the two, viable where outlet density and basket size are both high enough to absorb the cost of a brand-owned sales team.
Quick commerce complicates this further because it does not map cleanly onto any of the three. It behaves like modern trade in its centralized ordering but like a direct channel in the speed and SKU-level data it returns, and brands still writing it into a general trade playbook are underusing the one channel that hands back near-real-time sell-through data.
The practical test for channel mix is simple to state and hard to execute: does the model match the outlet's basket size and visit economics, or does it match how the company has always sold in that territory? The two answers diverge more often than most commercial teams expect.
Where cost-to-serve should end the conversation
Cost-to-serve is the number that should discipline every segmentation and channel decision above, and it is the number most RTM plans calculate last, if at all. It answers a specific question: what does it actually cost, in rep time, fuel, credit risk, and reload trips, to keep one outlet properly serviced at its assigned tier?
When cost-to-serve is calculated honestly, a meaningful share of outlets in most networks turn out to be marginal or unprofitable at their current visit frequency. That is not a reason to drop them. It is a reason to either right-size the service level, shift them to a lower-cost channel such as a distributor-run direct store delivery route instead of a dedicated rep visit, or fold them into a wholesaler relationship that carries the cost more efficiently than a company-owned beat can.
Brands that never run this calculation tend to discover the problem the hard way, when a cost review forces an across-the-board coverage cut that hits good and bad outlets equally, instead of a targeted reallocation that protects the outlets actually worth the visit.
Making the strategy survive contact with the field
An RTM strategy that only exists in a planning document is not a strategy, it is a slide. It becomes real when three things happen together: the segmentation is rebuilt on a cycle that matches how fast outlet behavior actually changes, usually quarterly rather than annually; distributor and rep incentives are realigned to the new tiers instead of left pointed at the old ones; and field teams get visibility into why an outlet's tier changed, not just an updated beat plan with no explanation.
That last point matters more than most rollouts account for. A beat plan that changes without explanation reads to a field rep as arbitrary, and reps who do not trust the plan quietly revert to their own judgment within a few weeks. The RTM strategy holds only as long as the people executing it can see the logic behind it.
Frequently asked questions
A route-to-market (RTM) strategy is the operating model a brand uses to decide how it reaches every outlet in its distribution universe: which channel serves each outlet, at what visit frequency, through which distributor or direct route, and at what cost to serve. It is the execution layer beneath a broader go-to-market plan.
Applying one coverage model to outlets that behave differently produces two failures at once: stockouts on fast-moving outlets that needed more frequent visits, and dead inventory on slow-moving outlets that needed fewer. Segmenting by sales velocity, basket size, growth trend, and credit risk lets a brand match visit frequency and stock norms to how each outlet actually sells.
Match the channel to outlet density and basket size rather than company history. General trade suits high-density, lower-ticket outlets and runs through distributors by necessity. Modern trade suits centralized, key-account-led buying. Direct-to-retail works where density and basket size both justify a brand-owned sales team. Most networks need a deliberate mix, not a single default.
Cost-to-serve is what it actually costs, in rep time, fuel, credit risk, and reload trips, to keep one outlet properly serviced at its assigned visit tier. Calculating it honestly usually reveals that a meaningful share of outlets are marginal at their current service level, which should trigger a right-sized visit frequency or a lower-cost channel, not an across-the-board coverage cut.
Outlet behavior shifts faster than most annual planning cycles account for. Reviewing segmentation quarterly, rather than annually, catches outlets that have moved tiers before the mismatch shows up as stockouts or dead stock, and keeps distributor and rep incentives aligned to current reality rather than last year's map.
Turn RTM strategy into an executable plan
See how Vxceed helps commercial teams segment outlets, model channel mix, and track cost-to-serve as one connected system instead of three separate spreadsheets.
Request a demo

