Sales Force Productivity: The Metrics That Predict Revenue, Not Just Activity
 Team Vxceed · September 2026
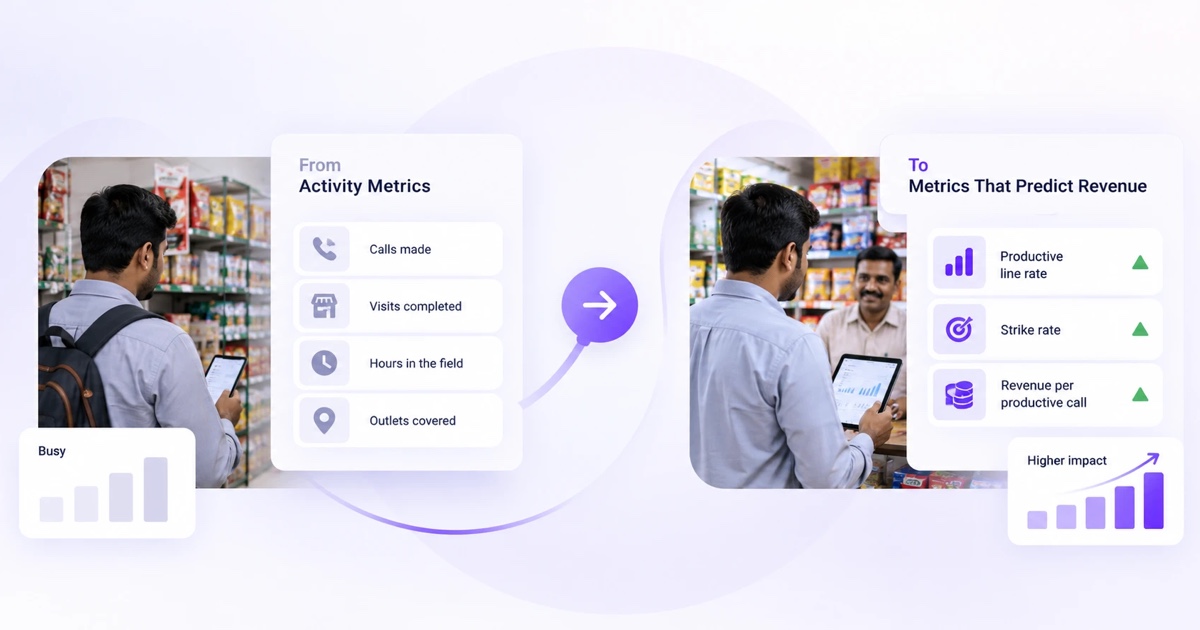
A field sales scorecard built around calls made, visits completed, and hours logged rewards a rep for being busy, which is a poor proxy for being effective. Two reps can log identical activity numbers, same call count, same hours in the field, same outlets covered, and produce wildly different revenue, because activity metrics say nothing about whether those calls actually converted into orders worth taking.
This is not a new observation, and most sales leaders would agree with it immediately if asked directly. The gap is between agreeing with the principle and actually changing the scorecard, because activity metrics are easy to capture automatically while the metrics that actually predict revenue require a bit more structure to define and track.
Three metrics that outperform activity counts
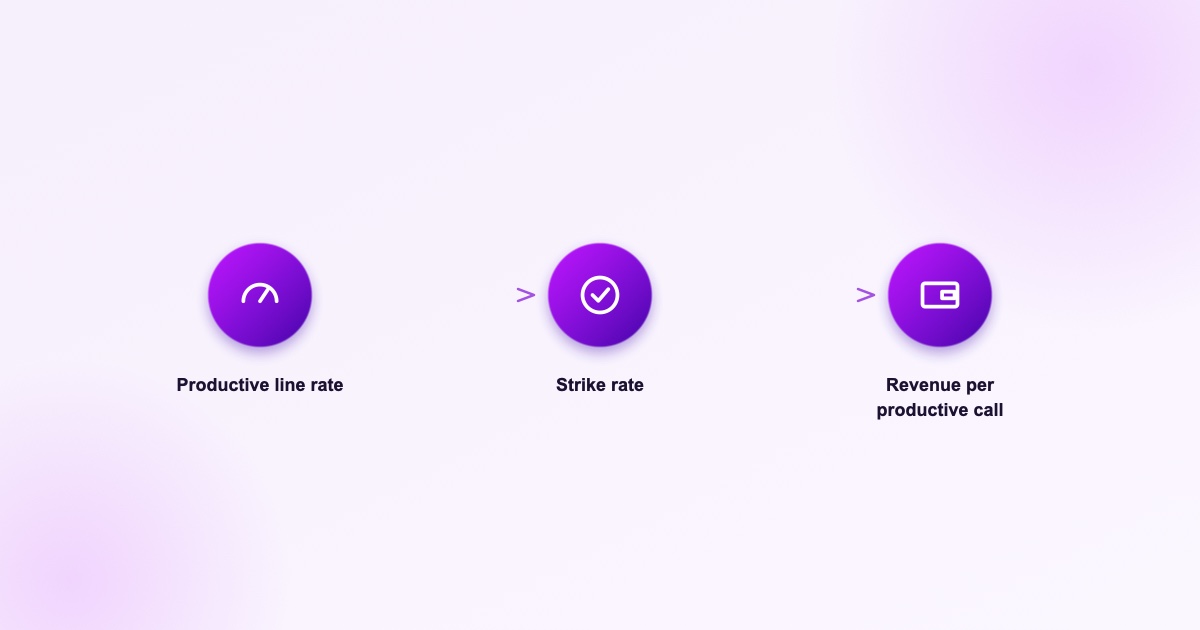
Productive line rate measures how many SKUs, on average, a rep sells into an outlet per call, against the full range available in that outlet's category mix. A rep consistently selling three lines into outlets that could reasonably carry eight is leaving revenue on the table in a way that a raw call count will never reveal.
Strike rate measures the share of calls that actually convert into an order, of any size, versus calls that produce nothing. A low strike rate paired with a high call count usually means a rep is spreading effort across too many low-probability outlets instead of prioritizing the ones likely to convert, which is a coverage design problem as much as an individual performance one.
Revenue per productive call combines the two: among calls that do convert, how much revenue does each one generate. This is the number that most directly answers whether a rep's time in the field is translating into commercial outcomes, and it is the one most scorecards omit entirely in favor of a simple call-count target.
Why activity metrics persist despite everyone knowing better
Activity metrics survive because they are simple to capture, simple to explain in a monthly review, and hard to dispute: a call either happened or it did not. Productivity metrics require a working definition of what counts as productive, category-specific benchmarks for what a full line count should look like in a given outlet type, and enough historical data to know what a reasonable strike rate target actually is for a given territory.
That setup cost is real, and it is also a one-time cost against an ongoing benefit. Once productive line rate and strike rate baselines exist for a territory, tracking them is no harder than tracking call counts, and the resulting scorecard tells a sales manager something genuinely actionable instead of just confirming that reps left the office.
What changes when reps are scored on this instead
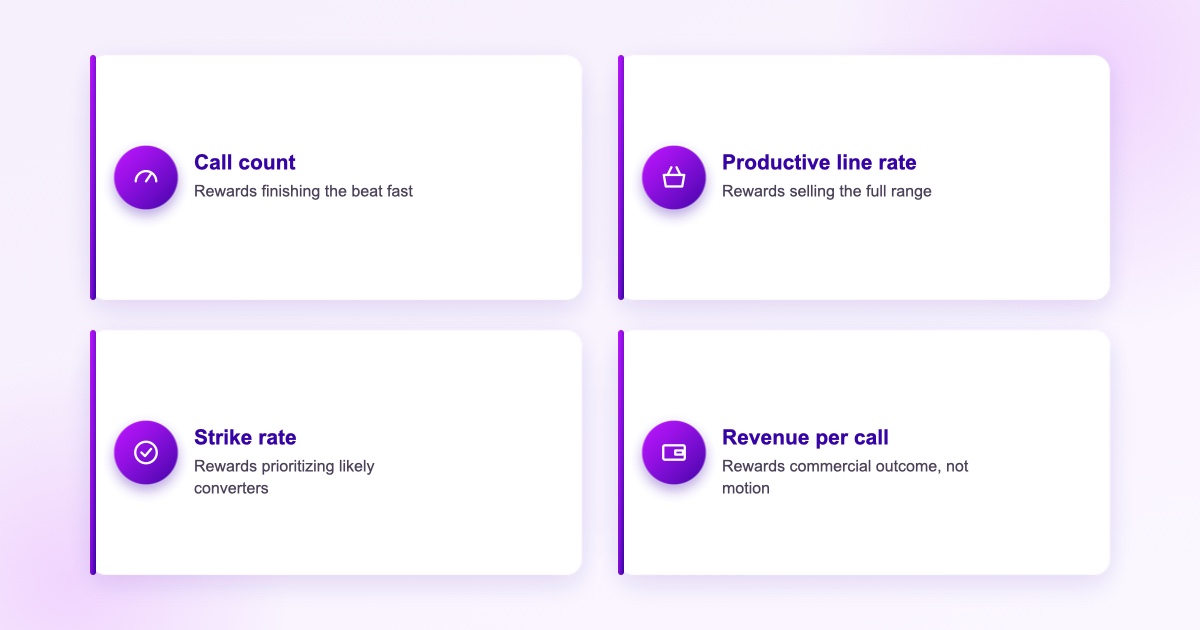
A rep scored on call count optimizes for finishing the beat quickly, which rewards short, low-value visits. A rep scored on productive line rate and strike rate optimizes for the quality of each call, which tends to mean spending more time on outlets likely to convert and less time on ones that historically do not, even if that means fewer total calls in a day.
This shift is not always comfortable for a team used to counting visits, and it usually surfaces uncomfortable truths quickly: some reps with excellent call counts turn out to have mediocre strike rates, and some reps who never led the activity leaderboard turn out to be the most commercially effective people on the team. That reshuffling is the point, not a side effect to manage around.
Building the baseline before changing the scorecard
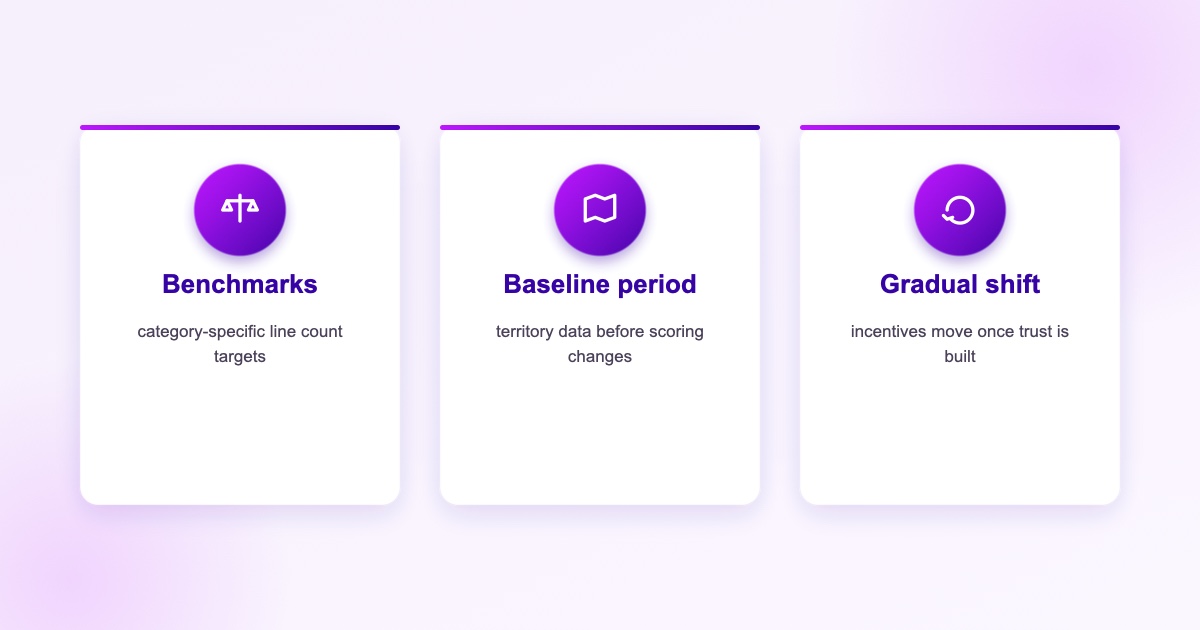
Switching a scorecard overnight, from call count to strike rate, without a baseline period first, tends to produce confusion rather than better behavior, because reps and managers alike need a sense of what a good number actually looks like in their specific territory before it can function as a target. A reasonable sequence runs category benchmarks first, then a few months of territory-level baseline tracking alongside the existing scorecard, then a gradual shift in incentives once both sides trust the new numbers.
The teams that make this transition well tend to keep activity metrics visible, they still matter for coverage integrity, but stop treating them as the primary measure of performance. Activity confirms the beat happened. Productivity confirms it was worth running.
Frequently asked questions
They measure activity, not effectiveness. Two reps can log identical call counts and hours in the field and produce very different revenue, because activity metrics say nothing about whether those calls actually converted or how much each conversion was worth.
The average number of SKUs a rep sells into an outlet per call, measured against the full range that outlet's category mix could reasonably carry. A low productive line rate against a high call count indicates reps are underselling into outlets rather than covering too few of them.
The share of calls that convert into an actual order, of any size, versus calls that produce nothing. A low strike rate paired with a high call count often points to reps spending time on low-probability outlets instead of prioritizing ones likely to convert.
Activity metrics are simple to capture and hard to dispute. Productivity metrics require category-specific benchmarks and territory baselines to interpret correctly, which is a real setup cost, though a one-time one against an ongoing benefit.
Build category benchmarks first, track productivity metrics alongside the existing scorecard for a baseline period, then shift incentives gradually once managers and reps trust the new numbers. Keep activity metrics visible for coverage integrity, but stop treating them as the primary performance measure.
Track the metrics that actually correlate with revenue
Vxceed surfaces productive line rate, strike rate, and revenue per call alongside the activity metrics teams already track, so performance conversations start from the right numbers.
Request a demo

