What Good SFA Adoption Looks Like: Beyond Attendance and GPS Tracking
 Team Vxceed · September 2026
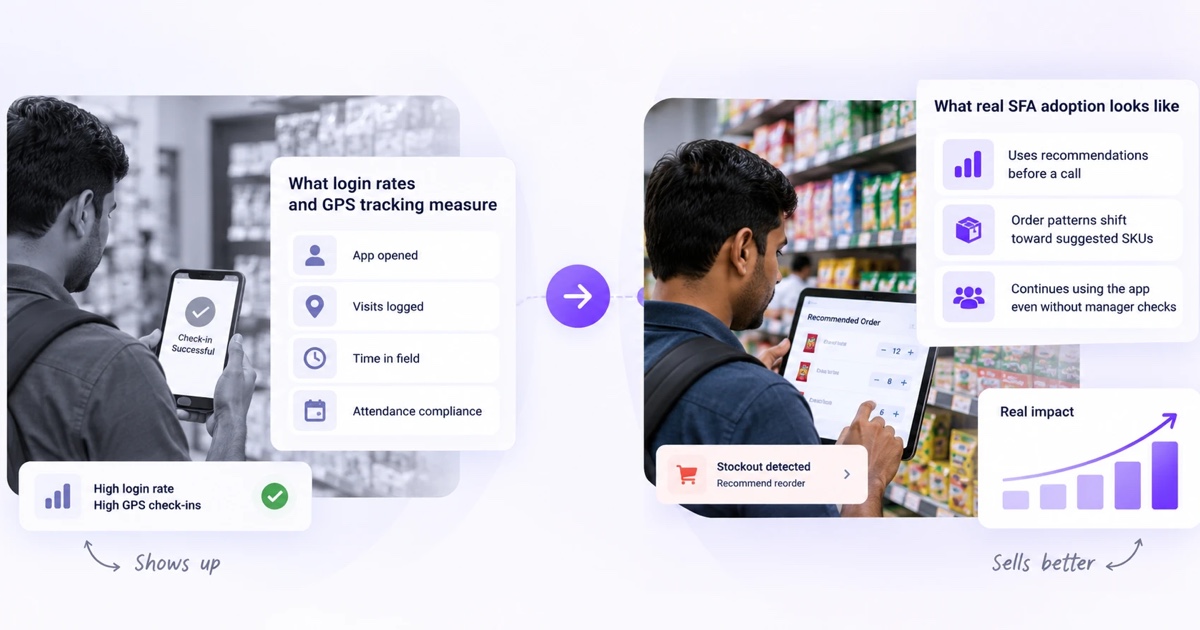
Ask most sales operations teams how their SFA rollout is going, and the answer arrives as a login percentage. Ninety-two percent daily active usage, GPS check-ins confirmed at ninety-six percent of scheduled visits, attendance logged automatically instead of on paper. These numbers get presented as adoption, and they measure something real: whether reps are opening the app and showing up where they are supposed to be. What they do not measure is whether the app has changed a single thing about how those reps actually sell.
A rep can open the app every morning, check in at every outlet on schedule, and still run the entire visit exactly as they would have with a paper order book. That is not a hypothetical failure mode, it is the default outcome of an SFA rollout measured only on attendance metrics, because attendance is the easiest thing to fake compliance around and the hardest thing to learn anything commercial from.
Why login rate is the wrong finish line
Login rate answers one question: did the rep open the app. It says nothing about whether they used the recommended order quantity, acted on a stockout alert, or followed the suggested visit sequence instead of their own habitual route. A network can report near-universal login compliance while every rep quietly reverts to selling exactly the way they did before the app existed, and the dashboard will not show the difference.
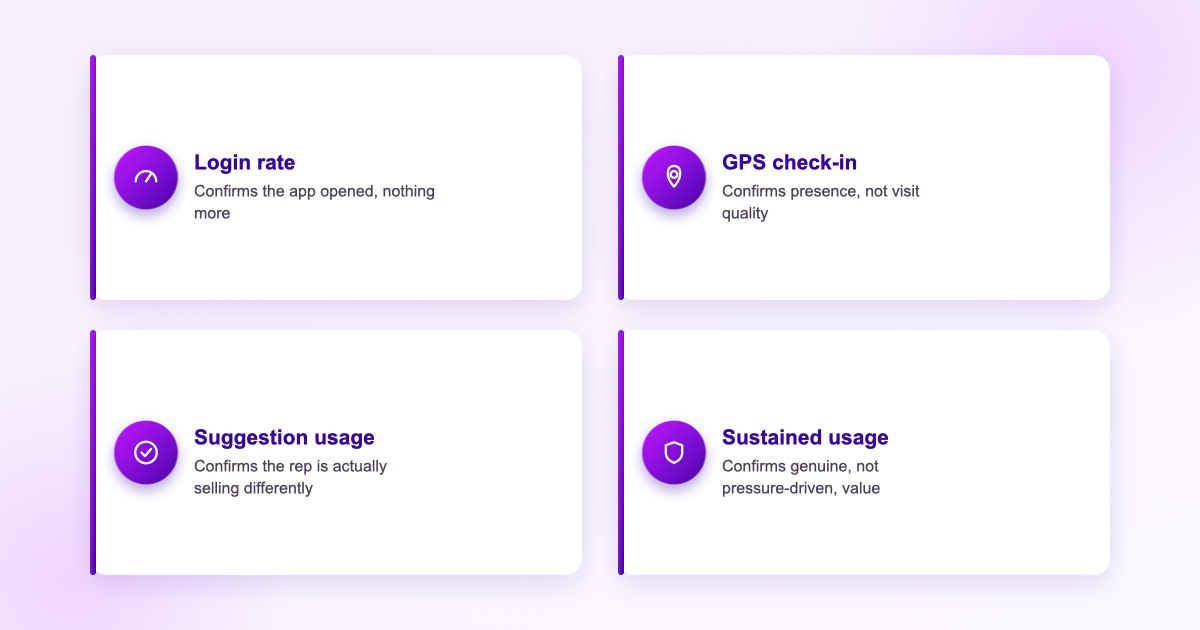
GPS tracking has the same limitation from a different angle. It confirms presence, which matters for coverage integrity, but presence is not the same as a productive visit. A rep who checks in, spends four minutes at an outlet, and leaves without addressing a visible stockout has satisfied every attendance metric the system tracks while delivering none of the commercial value the visit was scheduled for.
Three signals that actually indicate adoption
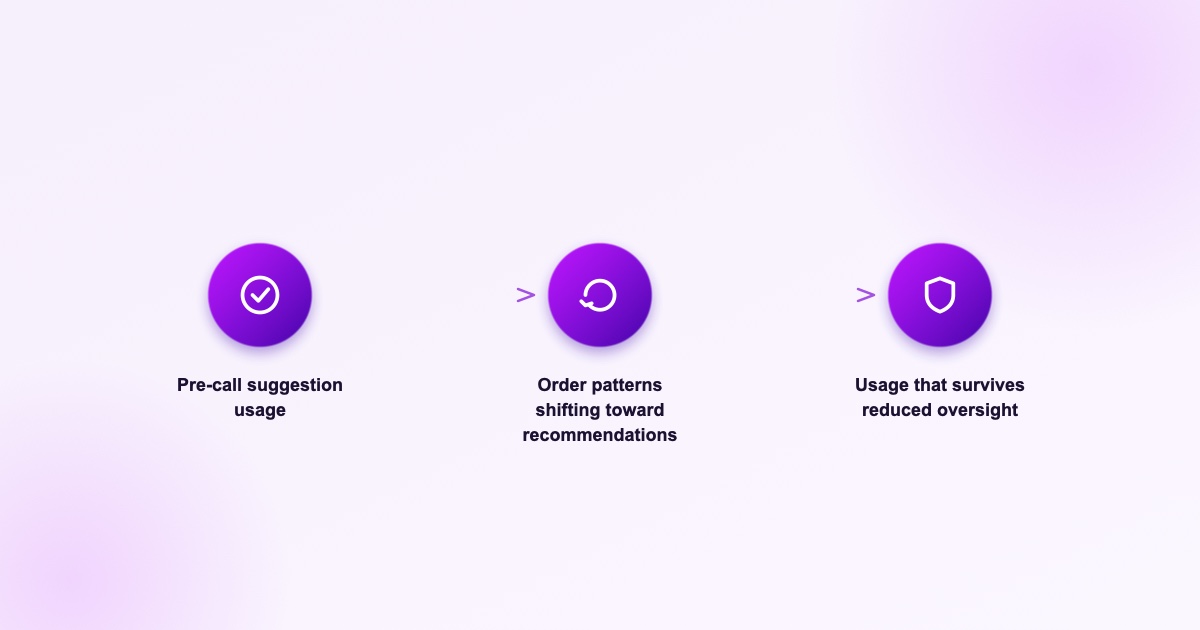
Pre-call suggestion usage. Whether a rep checks the app's recommended order quantity, stock alerts, or scheme information before walking into an outlet, not after the visit is already logged, is one of the clearest tells that the tool has become part of how they prepare, not just a form they fill out afterward.
Order pattern shift. If a rep's actual order quantities start tracking closer to what the system recommends over time, rather than staying anchored to habit regardless of what the app suggests, that is behavior change, not compliance. This is the single strongest predictor that the tool is influencing commercial outcomes rather than just recording them.
Usage that survives reduced oversight. Adoption driven purely by a manager checking a dashboard tends to collapse the moment that scrutiny relaxes. Usage that holds steady when the app stops being actively policed is the strongest evidence that reps have found genuine value in it, not just compliance pressure to tolerate it.
Why field reps abandon tools that technically work
Most SFA tools that fail adoption do not fail on functionality. They fail because they add friction to a visit without visibly returning value to the rep making it. A recommendation engine that suggests order quantities without explaining why, or a form that takes three extra minutes to complete for no benefit the rep can see, teaches a field team that the app is corporate overhead rather than a selling tool.
The reps who actually adopt a tool tend to be the ones who can point to a specific moment it helped them: a stockout it flagged before a customer complained, a scheme it surfaced that closed an extra order, a route suggestion that saved real time on a long beat. Adoption sustains itself when reps experience the tool as leverage rather than surveillance, and it collapses when they experience it as the opposite.
What to actually measure instead
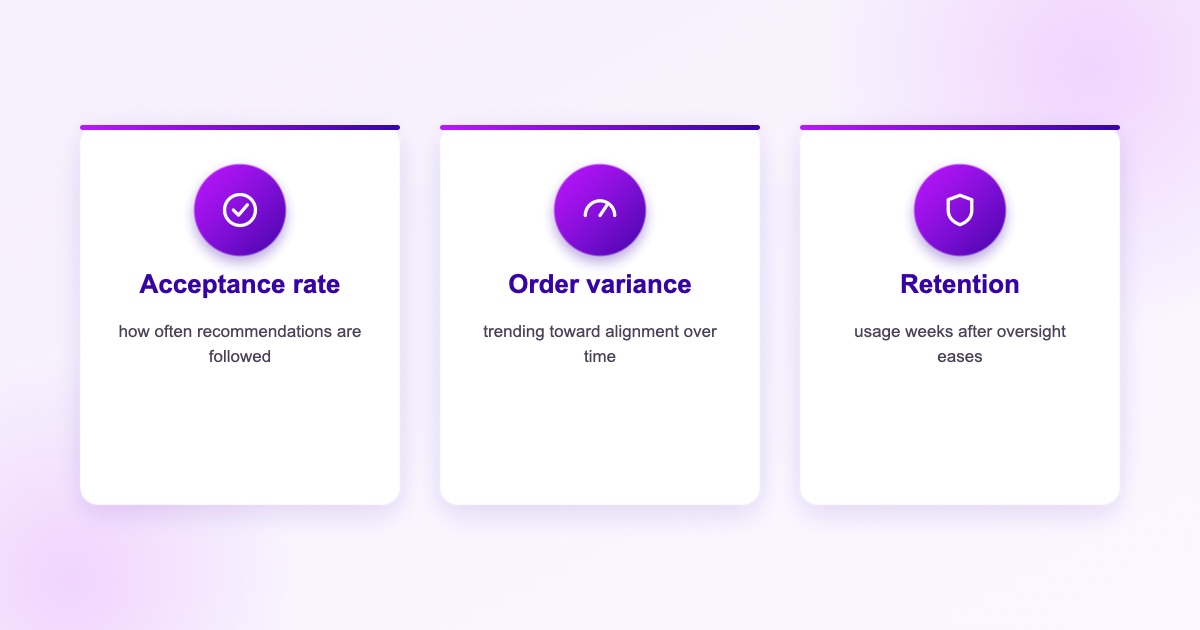
Suggestion acceptance rate, how often a rep follows a recommended order quantity or scheme, is a far better leading indicator than login rate. So is variance between recommended and actual order quantity over time, trending toward alignment rather than staying flat regardless of what the system suggests. And so is usage retention measured a few weeks after a manager stops actively checking the dashboard, which separates genuine adoption from pressure-driven compliance more clearly than any single-day attendance snapshot ever will.
None of these metrics are harder to instrument than login rate. They are simply less flattering in the early months of a rollout, which is exactly why so few organizations choose to track them, and exactly why the ones that do end up with a much more honest read on whether the investment is working.
Frequently asked questions
Login rate confirms a rep opened the app, not that it changed how they sell. A rep can log in every day, check in at every outlet on schedule, and still run every visit exactly as they would have with a paper order book, and login metrics will not show the difference.
Whether reps check recommendations before a call rather than after, whether actual order quantities shift toward what the system recommends over time, and whether usage holds steady once manager oversight relaxes. These three signals track behavior change, not just compliance.
Most abandonment happens when a tool adds friction to a visit without visibly returning value to the rep. Reps who can point to a specific moment the tool helped them tend to keep using it; reps who experience it purely as a reporting requirement tend to revert to old habits as soon as oversight relaxes.
Suggestion acceptance rate, the gap between recommended and actual order quantities over time, and usage retention measured weeks after active manager monitoring eases. These predict commercial impact far more reliably than attendance metrics.
No. GPS tracking confirms presence at an outlet, which matters for coverage integrity, but a rep can satisfy every GPS and check-in requirement while spending minimal time addressing what the visit was actually scheduled to fix, such as a visible stockout.
Measure SFA adoption that actually predicts revenue
Vxceed tracks the field behaviors that correlate with commercial outcomes, not just whether the app opened this morning.
Request a demo

